|
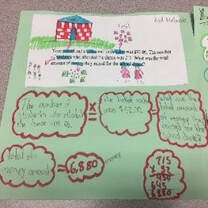
This blog was inspired by a CMC call for articles., an organization that I am a member of. It shares some of the visualizing mathematics strategies I used in my classroom to impact teaching and learning, a technique that is extremely powerful in deepening and extending learning. As a result of this technique and others, 100% of my students were successful in state tests for consecutive years. For me, it is not about the scores, but instead the profound and enduring learning experiences and connections to real-world situations that my students acquired, which translated to great scores. Visualization is defined as the “formation of mental visual images and the act or process of interpreting in visual terms or of putting into visible form” ~ Merriam Webster dictionary. In this definition, it is noted that visualization relates to mental and visible forms. In teaching mathematics to students, both forms of visualization are extremely important and are interconnected; the visible form is profoundly impacted by the mental visual form. Before we can create a visible form, we need to create a profound mental image in our mind. Visualizing mathematics has extensive benefits in teaching and learning mathematics. Some of the benefits explored in this article are those relating to and involving literacy skills, math research and labs, and math conversations. Students develop literacy skills and make deeper inferences and profound connections to cross-curricular and real-life situations when they engage in visualizing mathematics. Incorporating math tasks and math labs that require research deepens visualization in math and creates a plethora of connected mental and visible images. Math talk, student talk or student discussion, however termed, provides students with extensive opportunities to visualize mathematics and create profound visual products. Visualizing Mathematics to Develop Literacy Skills and Make Deeper Real-World Connections Mental Visual to Visible forms (word and pictures) Visualizing mathematics helps students develop literacy skills when they engage in mental visuals to visible forms of words and pictures to make great inferences and profound connections to real-world concepts in word problems and text. When students engage in mental visualization before they add their thoughts on paper to create a visible product, they make extensive connections to their personal experiences and information becomes even more relevant, meaningful and enduring before it is transferred to a visible form. One technique that is used to help students create a mental visual image is to have them close their eyes after reading a word problem or text and visualize the content. This is a very simple yet powerful strategy that helps students create dynamic mental visual images which they then transfer to visible forms using pictures and words. Some of my students chose to keep their eyes open, and this was allowed as well. In the pictures below, you will see my students’ examples of visible forms, end products of mental visuals that consist of words and pictures. In order to get students to master picture and word visible visualization so it becomes a natural part of their learning, have them work on one word problem or text at a time. Initially, it may take an entire period for students to complete one task/word problem, but it is definitely worth going slow to go fast when developing students’ literacy skills using mental visual to visible forms of pictures and words.
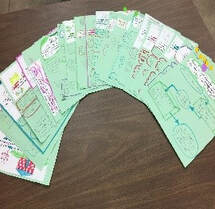
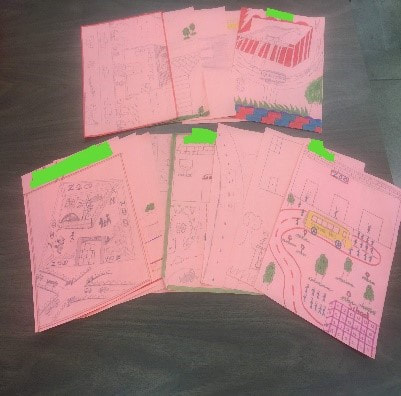
Visible Text to Mental Visual to Visible Form – Picture only Visualizing mathematics using the mental visual to a picture only visible form allows students to spend extensive time exploring the real-world concepts and representing their understanding of the text with pictures only. The process of metacognition they engage in is in-depth and helps in creating stronger neural connections for concepts and real-world connections as information is accessed and explored numerous times. To reinforce, mental visuals to visible visualization using pictures only is a powerful strategy in helping students improve their comprehension and make deeper connections to the word problem and the real-world connection. As seen in the examples below, students are not expected to write words, but simply transfer inferences gained from visible text into a mental visual and then to a visible picture only. While this form of visualization may seem a bit elementary in nature, it is actually extremely impactful in helping high school students spend extensive time with word problems and tasks to heighten literacy skills. I initially used this strategy with a group of high school ELL students and I was amazed by the inferences they made and the enduring impact it had on their understanding and applications of concepts. The adage, “a picture paints a thousand words” is certainly true as these pictures allowed for an understanding that was so deep that it could be transferred into a thousand words.
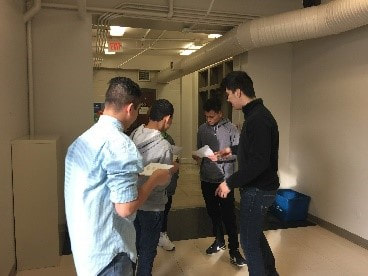
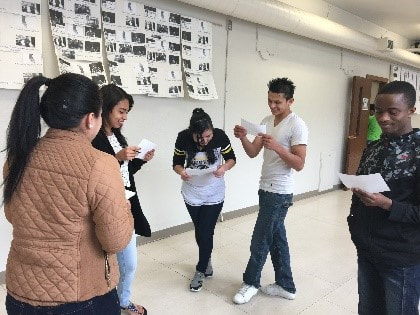
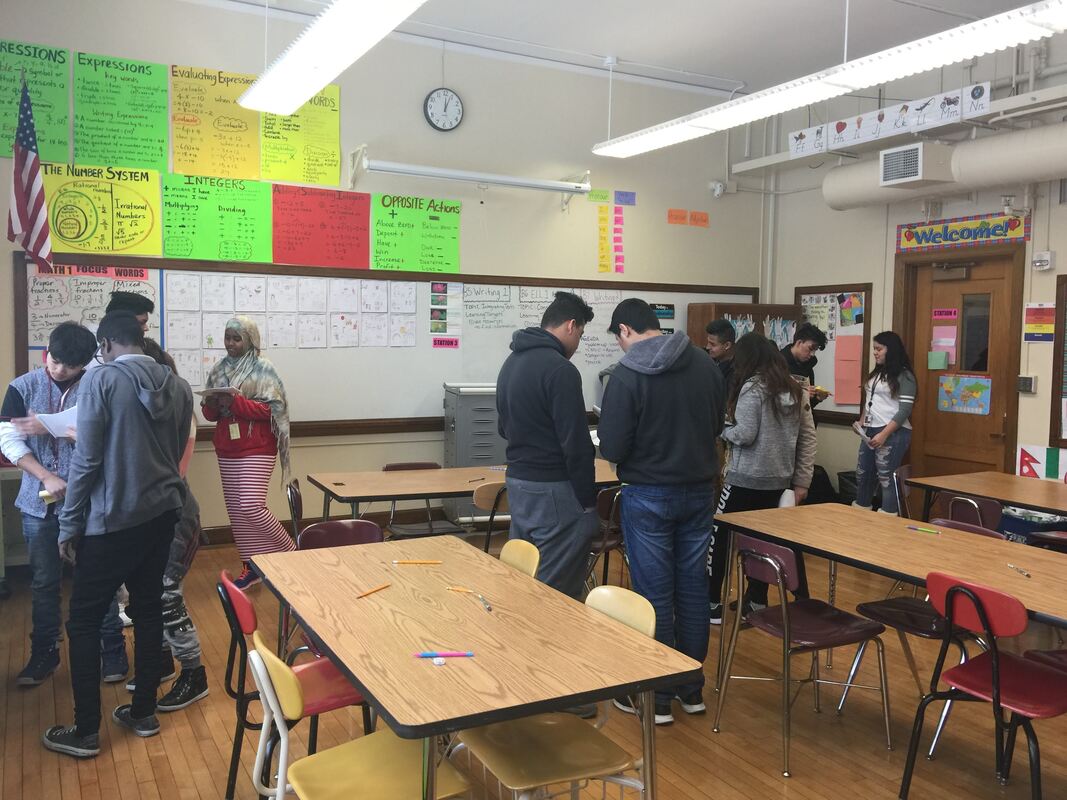
Role-Play Another strategy that profoundly helps with visualizing mathematics is role-play. Role-play is a pedagogical strategy that I believe is underused, but it is actually at the “create” level in Bloom’s Taxonomy. When students engage in role-play, they spend extensive time simulating their plays which provides them with ample opportunities to make deeper connections to the text/word problem/real-world situation and transfer a visible form of mathematics (word problem/text) to mental forms and then visible form again. These visual forms and processes profoundly impact students’ literacy skills when they transfer mental visuals to visible visualizations of pictures, words and processes when solving word problems in math. Below, you will find some pictures of my students engaging in role-play to make deeper connections to the word problem. I have also had my ELL students engage in whole class role-play where the word problem related to students going to a dance. All students had to design their admission ticket, line up and enter the dance hall (the classroom). I played their favorite song, Whip Nae Nae for a minute or two, and they danced. After this role-play, they were required to transfer mental pictures gained when solving the word problem. I was amazed by how this quick and simple whole class role-play profoundly impacted their understanding and the depth of their products.
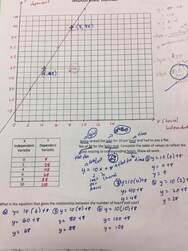
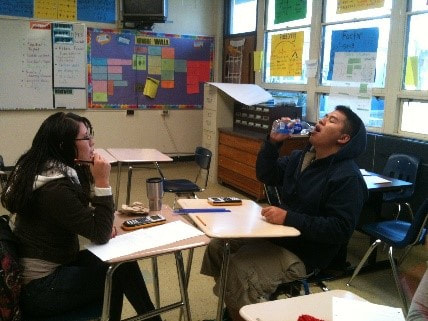
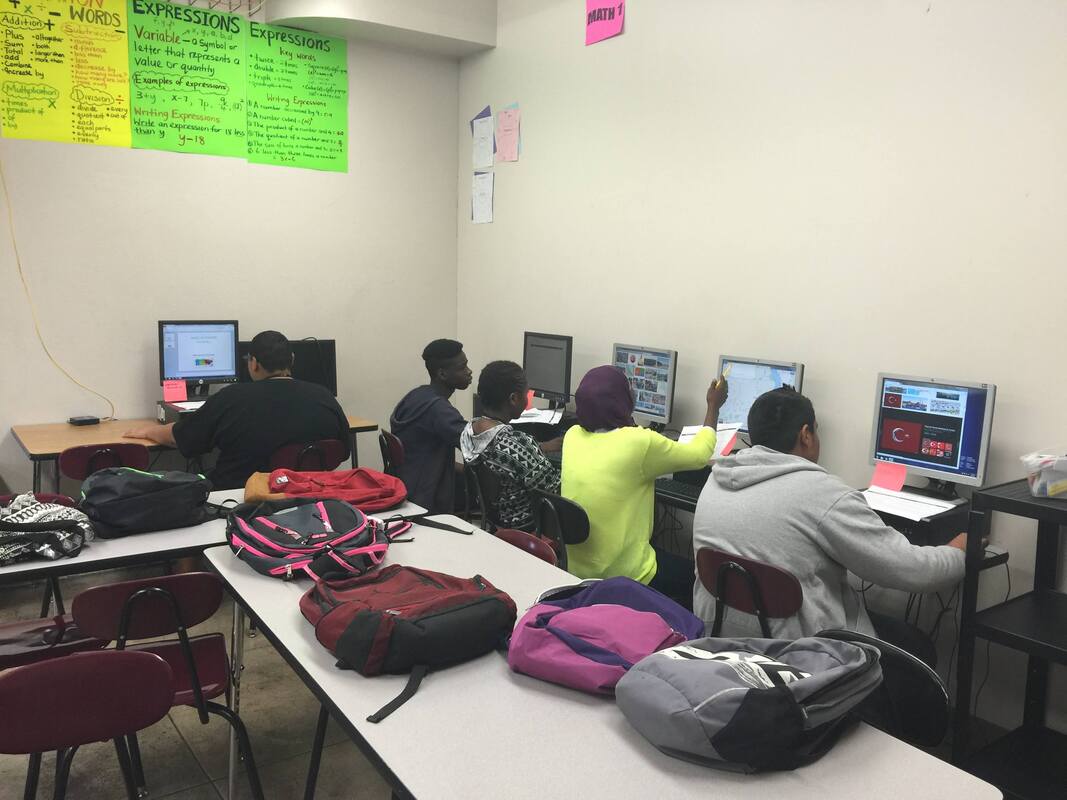
Research and Math Labs to deepen Visualization in Math Research When students are allowed extensive opportunities to engage in researching mathematical concepts and connections, new mental and visible forms are created. During research, a plethora of ideas are sparked and deepened as students are constantly gaining new knowledge. As a result, mental to visible and visible to mental forms of visualization are in constant practice, and enhanced in terms of content, details and depth. Remember, visible forms can take both written and pictorial form; written visual forms include graphic organizers and other methods of synthesis and profound representation of knowledge, which often also includes pictorial images. Research in math allows for new neural connections to be formed and the strengthening of previously formed neural networks making learning not only more enduring, but more rigorous. Research can be as simple and elaborate as we want it to be, but whatever the selection, it definitely impacts students’ ability to visualize mathematics and make deeper connections. Some examples of research I have used are, population and density in relation to The Number System, cliff diving and its connections to Quadratic Functions, crickets and temperature and its connections to Literal Equations, The History of The Great Wall of China and Equations, foreign exchange rates and Linear Functions, and more. Math Labs Having students engage in Math Labs is extremely beneficial and impactful in helping them visualize the in-depth concepts connected to the topics being explored because students are engaged in hands-on experiments which provide numerous mental and visible images. Visualizing mathematics becomes seamless during Math Labs since students are constantly using tangible products and materials which are transferred into mental images and then transformed into visible forms again when they draw conclusions, plot graphs, create models, write reports and explain learning. When creating Math Labs, be sure to add reflective questions that will heighten students’ ability to engage in visualizing mathematics to make deeper real-world connections. Below are some pictures of The Big Gulp Math Lab that I had my students engage in. Here are a few of the questions I asked students when they engaged in this lab: If you decreased the size of your gulps, how would your graph change? If the initial height of the water and the size of your gulps remained the same, what change would you observe if the diameter of the bottle was smaller or larger? Visualizing mathematics during this lab and others that I incorporated helped tremendously with students understanding, application and extension of topics relating to units on Scatter Plot and Linear Functions.
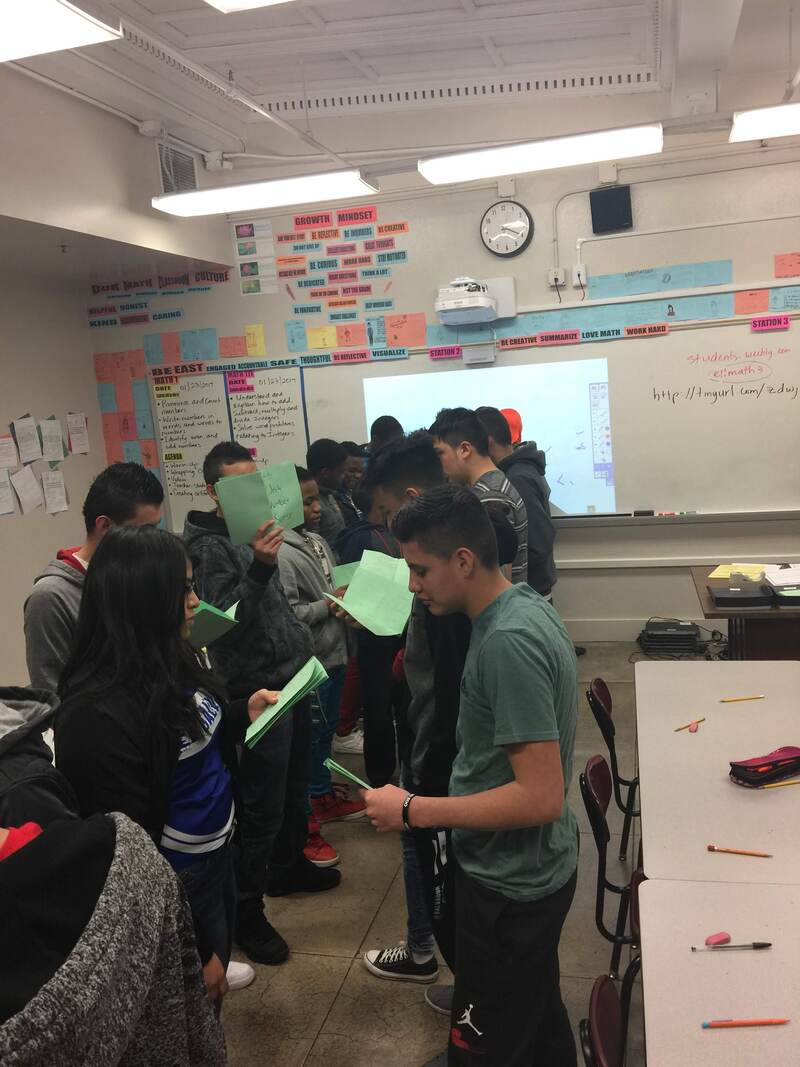
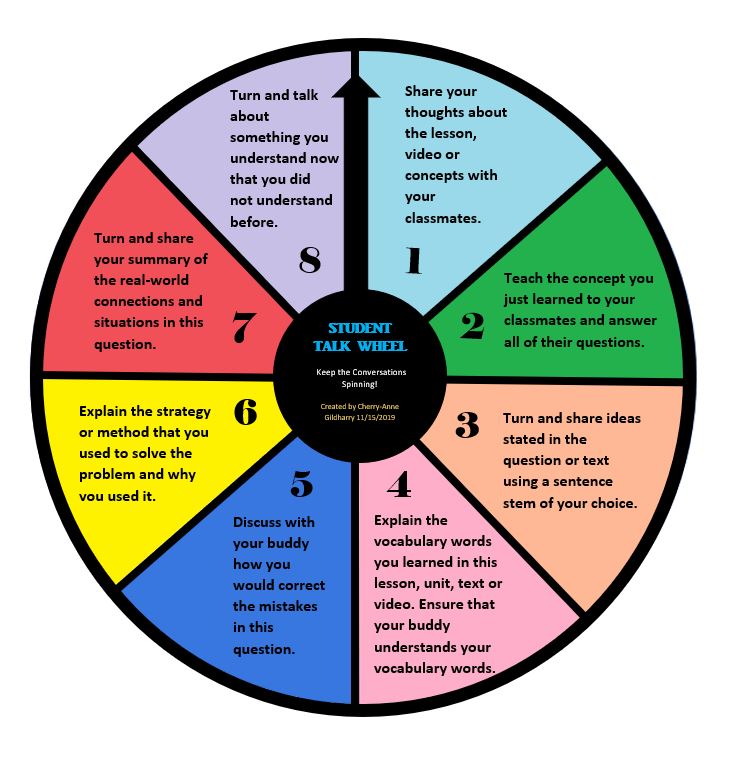
Student Talk Providing students with the opportunity to engage in math conversations profoundly impacts visualization as students are able to transfer their mental thoughts into a discernable form as they verbally share their ideas with peers and then create or add to a visible product based on ideas discussed. During discussions, students are constantly retrieving information learned and gaining new ideas from conversations with their peers to extend learning. As previously mentioned, this process strengthens the neural connections and makes learning more enduring. Requiring students to have a visual image as they engage in discussion helps even more with visualizing mathematics. To ensure that learning is even more meaningful, rigorous and authentic, make it a requirement that they engage in metacognition after the discussions to revise their product using ideas gained during discussions. Discussions not only enhance visualizing mathematics for deeper concept attainment, but it heightens critical thinking skills because students are examining theirs and others’ ideas, explaining their ideas, collecting ideas and drawing conclusions in order to produce mental and multiple forms of visual images. I have included some pictures of my students engaging in student talk, as well as a Student Talk Wheel that I created to get students involved in discussions.
“More than 50 percent of the cortex, the surface of the brain, is devoted to processing visual information,” ~ William G. Allyn Professor of Medical Optics. This bit of information alone encourages us to ensure that we focus on strategies for helping students visualize mathematics. Not only do we see an increased impact on developing literacy skills when students spend time visualizing mathematical concepts, but also more in-depth learning due to the creation of stronger neural pathways. When we engage in visualizing mathematics, we are activating neurons multiple times or creating new neurons and neural pathways; we are increasing neuroplasticity. Neuroplasticity refers to the lifelong capacity of the brain to change by creating new neural pathways in response to the stimulation of learning and experience (Neuroplasticity, 2010). As educators, we can help our students’ brains grow by simply incorporating any of the visualizing mathematics techniques shared here or elsewhere. Visualizing mathematics is key to deepening and extending learning for all students. References
Warren, E. (2013). Teaching Visualization Can Improve Academic Achievement for Students at Any Age. https://minds-in-bloom.com/teaching-visualization-can-improve Sarrasin, J. B., Foisy, L. B.(2020). Understanding Your Brain to Help You Learn Better. https://kids.frontiersin.org/articles/10.3389/frym.2020.00054 Reusc, J. (2017). The Power of Visualization in Math. https://www.edutopia.org/article/power-visualization-math Hagen, S. (2012). The Mind’s Eye. Rochester Review. 14(3), 33-37. Comments are closed.
|
Cherry-Anne GildharryOn this page, you will find blogs on educational connections and my life's experiences. Ideas, thoughts and views are my own and are not representative of my employers. References/sources used are public articles found on the internet to support my blogs. Archives
April 2024
Categories |


 RSS Feed
